Madrid: Beginning to Solve a Massive Problem with a Drawing
This week in our Doctor of Ministry cohort we were tasked with reading the book The Back of the Napkin: Solving Problems and Selling Ideas with Pictures by Dan Roam and put the thesis of the book into action. Roam’s central point is that when we draw out our ideas and problems we can see, look, and better understand all the perspectives of the issue, as well as communicate clearly what we want to do.
The current problem I chose to address pertains to the city of Madrid and how to reach the hundreds of thousands of university studying in one of Europe’s most massive cities. Currently, we have no staff presence in Madrid, but are beginning to talk to Cru ministries in the states about forming partnerships where they can begin to send short and long term teams to begin to reach university students. With this in mind, we need to begin to visually imagine in a city of Madrid’s size, where do we send resources? Where do we focus our energies? Where should new staff to the city live? Where are the students? In fact, Roam suggests running any idea through a series of questions, and then correlating that specific question to a visual image. Since we are essentially asking a where question, Roam suggests a making a map. For this, I generally conceived of Madrid as two large concentric circles. Within the interior circle is Madrid proper, the city, and the outer ring is the Community of Madrid, the wider province complete with villages and cities not geographically connected to Madrid city.
After imagining Madrid in this fashion, I began locating universities on my map, and also indicating the amount of students studying in each university. Next I divided Madrid by north and south, and east and west, to form four quadrants to also give us a special sense of the city, to further concentrate on the “where” of where people should be sent. Roam also suggests taking any problem through SQUID, another series of questions to refine our visual problem solving. In short, is the problem we are working with dealing in values of:
Simple or Elaborate
Quality or Quantity
Vision or Execution
Individual or Comparison
Delta (Change) or Status Quo
This problem is attempting to focus primarily on quantity, or specifically, where are the most number of students located? Moreover, it is comparison, showing the difference between different parts of the city in university location and student population. Thus, to help articulate these aspects of the problem, I added a graph into the map which highlights quantity and comparison.
I also believe this drawing can be used to communicate vision, as is allows for people to see need and possibility.
Ultimately, the drawing answers the question of where resources can go to be the most effective. There is a high concentration of students in the northwest quadrant, specifically within Madrid. At the same time we see that there are only three universities and 13,000 students in the wider Community of Madrid Province. Perhaps, this would not be an area to initially focus on. Thus, if we only had one team to send, it would be to the northwest quadrant of Madrid proper. If other teams were to arrive, there could be opportunities to work with the southwest quadrant, where there is another grouping of three universities. The map also raises some other problems that need solving. For instance, the northeast quadrant contains two universities and 54,000 students, but those universities are very far apart from each other. Perhaps another map needs to be drawn just for the this quadrant to begin to brainstorm how to reach both.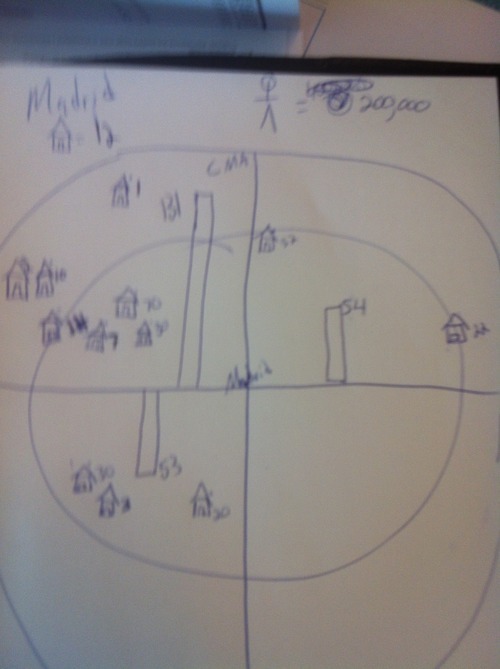
Leave a Reply
You must be logged in to post a comment.